Numbers
SaaS revenue multiples: why can 8.5x and 3.3x both be right?
Seen as an NTM vs TTM revenue multiple question, 8.5x and 3.3x look contradictory, but both can be accurate because they count different things: 8.5x NTM is an average across a fast-growing cloud index, 3.3x TTM a trailing median across a broad one. Forward against trailing runs the other way: at 13% growth, 3.3x trailing is 2.9x forward.
Where did 8.5x and 3.3x come from?
In late August 2026, the first page of US search results for SaaS revenue multiples put two figures in front of anyone pricing a software company: 8.5x on next-twelve-months (NTM) revenue, and 3.3x on trailing-twelve-months (TTM) revenue. Neither page said what else it was counting. The gap between them is 2.6 times, and the only explanation on offer was the label.
The label explains it the wrong way round. An NTM multiple divides the same enterprise value by next year's revenue, which is larger than last year's whenever a company is growing. For a growing business, the forward multiple is always the lower of the two.
Both numbers can still be right, as answers to different questions. Re-checked against the publishers' own pages on October 17, 2026, a multiple in the 8s is what an average across a fast-growing cloud index produces: the BVP Nasdaq Emerging Cloud Index showed an average revenue multiple of 8.0x, across members averaging 20.6% revenue growth. A multiple in the low 3s is what a median across a broad index produced on trailing revenue in mid-2026: Software Equity Group's index of 106 public SaaS companies had a median of 3.2x EV/TTM in the second quarter. The 2.6-times distance between 8.5x and 3.3x measures what each figure counts, not where the market is.
One version of 8.5x was simply wrong. Value Add VC had published about 8.5x NTM as the median public SaaS multiple for mid-2026. On September 30, 2026 it withdrew the figure as unsupported and replaced it with Clouded Judgement's median of 3.4x NTM for June 5, 2026. Same statistic, same denominator, same date: that was a genuine disagreement, and the correction settled it in favor of the lower number.
What is the difference between an NTM and a TTM revenue multiple?
Both are EV to revenue multiples; they differ only in which twelve months of revenue sit underneath. EV/TTM divides enterprise value by revenue reported over the last four quarters. It is history, and it is the denominator lenders, boards and acquirers default to. EV/NTM divides by the coming four quarters: analyst consensus for a listed company, the management case in a private process. It prices the forecast, and it inherits the forecast's error.
LTM and TTM are the same window under two names, so the LTM vs NTM question is this one. The bridge between the bases is a single line: EV/TTM = EV/NTM × (1 + g), where g is expected growth from the last twelve months to the next twelve. A company trading at 4.5x forward and growing 13%, the median projected growth in Clouded Judgement's public cloud set on October 16, 2026, trades at about 5.1x trailing.
| Expected revenue growth, next 12 months | 3.3x EV/TTM, restated as EV/NTM | 8.5x EV/NTM, restated as EV/TTM | Where the growth rate comes from |
|---|---|---|---|
| 0% | 3.3x | 8.5x | Flat revenue: the two bases coincide |
| 13% | 2.9x | 9.6x | Median projected NTM growth, Clouded Judgement, October 16, 2026 |
| 20.6% | 2.7x | 10.3x | Average revenue growth, BVP Nasdaq Emerging Cloud Index, October 17, 2026 |
| 40% | 2.4x | 11.9x | Illustrative high-growth company |
Restating the two figures on one basis never closes the gap; it widens it. At median growth, 8.5x forward is 9.6x trailing, nearly three times 3.3x. The NTM vs TTM revenue multiple question has a mechanical answer, and at every growth rate in the table, from 13% to 40%, it pushes the two figures further apart.
If the denominator does not explain the gap, what does?
Three things the labels leave out, each larger than the choice of denominator.
The first is the statistic. An average is pulled toward the highest multiples in a set; a median is the middle company. Public software is skewed enough for the difference to dominate. In the week to October 16, 2026, Clouded Judgement put the median public cloud company at 4.5x NTM revenue and the median of the five most expensive at 34.5x. A handful of companies above 30x moves an average by several turns and barely moves the median.
| Group | Projected NTM revenue growth | Median EV/NTM revenue |
|---|---|---|
| High growth | Above 22% | 18.7x |
| Mid growth | 15% to 22% | 7.3x |
| Low growth | Below 15% | 3.7x |
| Five highest multiples | Not a growth group | 34.5x |
| All companies | Median 13% | 4.5x |
The second is the peer set. Bessemer's index members average 20.6% revenue growth; median trailing revenue growth in Software Equity Group's index is 13.3%. Growth is the largest single driver of a SaaS revenue multiple, and the table shows how far it reaches: the same week, the same denominator, and 3.7x against 18.7x. Bessemer's 20.6% average falls in Clouded Judgement's mid-growth band, where the median company trades at 7.3x NTM, more than twice 3.3x.
The third is the date. Public multiples rose by a third or more between June and October. Clouded Judgement's median went from 3.4x NTM on June 5 to 4.5x on October 16. Software Equity Group's trailing median was 3.2x in the second quarter; its live index page showed 4.5x on October 17. A 3.3x trailing figure is a mid-2026 reading, and an investor quoting it in October sits more than a turn below Software Equity Group's live 4.5x.
Two matching figures mislead as easily as 8.5x and 3.3x. On October 16 and 17 the forward median and the trailing median both read 4.5x, and they cover different companies. On a single company growing 13%, 4.5x forward is 5.1x trailing, so the coincidence says nothing about whether one index is cheap against the other.
This is the same discipline that applies when you reconcile two market size estimates: establish what each number counts before asking which one is right. Here 8.5x and 3.3x were both right, one about an index average and the other about a broad trailing median, and neither page said which.
Which multiple belongs in an IC memo for a private software company?
Private buyers reference NTM but rarely anchor on it. They negotiate from trailing revenue or current ARR, then adjust for how much of the forecast they believe, especially where AI upsell or embedded payments are still unproven. Software Equity Group put the median private SaaS acquisition at 4.0x EV/TTM revenue in the second quarter of 2026, above the 3.2x public median the same quarter. This means an entry multiple benchmarked against an index average of 8.0x starts about four turns above where private software has been clearing.
The defensible sequence has six steps. The 8.5x and 3.3x pages fail at the second: neither said what statistic or set it was counting.
- 01Name the denominator: trailing (TTM or LTM), forward (NTM), run-rate or ARR. A figure whose source does not say is not a comparable.
- 02Name the statistic and the set: median or average, how many companies, which index or which named peers.
- 03Match the set to the target on growth and scale before comparing levels; a target growing 30% does not price off a median company growing 13%.
- 04Date the figure. Public medians moved by a third between June and October 2026, so a quarter-old multiple describes a different market.
- 05Restate every comparable on the target's basis with the target's own growth: EV/TTM = EV/NTM × (1 + g).
- 06Apply private-market adjustments last and separately: scale, retention, and the gap between private deal medians and public trading, 4.0x against 3.2x EV/TTM in 2Q26.
The output is one multiple per comparable, each with its basis, statistic, set and date written beside it. That is the standard the market section of an investment memo is held to, for the same reason: the committee reads the label before the number.
When a partner asks why the memo uses 4.0x and not the 8.5x on the first page of search results, the answer is three facts rather than an opinion: the denominator, the statistic and the date. They are the same three questions used to defend a market size estimate in the room.
How should SaaS revenue multiples be compared by sector?
Within one source, on one basis. Software Equity Group's second-quarter trailing medians put vertically focused SaaS at 3.7x against 3.2x for the whole index, with DevOps and IT management highest at 5.3x. Multiples.vc's October table, on forward revenue, puts real estate software at 3.2x and financial services software at 3.0x, against a vertical SaaS median of 2.2x.
Set the two sources side by side and vertical SaaS appears to trade at 3.7x and 2.2x at once. Both are right. One is trailing and the other forward; one is a 106-company index and the other a different universe of listed software companies; the dates are a quarter apart. Published SaaS valuation multiples compare cleanly only inside a single dataset, so the comparable for a vertical target should come from named companies, such as Veeva, AppFolio or nCino, on the target's own basis.
An EV to revenue multiple is a ratio with four labels attached: basis, statistic, set and date. Quote the definition with the number, every time, and the 8.5x-against-3.3x problem does not arise.
Worked example
How Caspr's Study kept 8.2x and 3.2x apart
Caspr's Market Research Study, Vertical SaaS Valuations 2025–2026, dated August 25, 2026, met the same pair of numbers and declined to blend them. On trailing revenue it anchored on Software Equity Group: a 3.2x median EV/TTM for the public SaaS index through the second quarter, 3.7x for vertically focused companies, and 4.0x for private SaaS M&A. On forward revenue it recorded an average public cloud multiple of 8.2x as of August 16, 2026, from Bessemer-linked tracking, labeled it an average, and noted that the median sat well below it. It then stated what it could not find: a reliable, current vertical-only NTM median in primary sources. It published none. Instead it made named trailing comparables the hard anchor (Veeva 10.1x, Guidewire 11.4x, Samsara 13.1x, AppFolio 7.5x, Tyler Technologies 6.4x, Procore 6.2x, nCino 4.3x, Toast 2.9x) and told investors to apply an NTM bridge company by company. The same Study recorded 3.3x for real estate software and for financial services software, and both were forward multiples, so the number in this post's title appears in the Study on the opposite basis. The Study's rule for the reader: TTM and NTM should never be conflated, because a company at 6.0x EV/TTM and 4.5x EV/NTM is not equivalent to one at 4.5x EV/TTM.
The figures, side by side
| Publisher | Figure | Unit | Period | Basis | Published | Last verified |
|---|---|---|---|---|---|---|
| Bessemer Venture Partners | 8.0 | x average revenue multiple | October 17, 2026 | Average across BVP Nasdaq Emerging Cloud Index members, whose revenue growth averages 20.6%; the headline label does not name the denominator | Live index page, read 2026-10-17 | 2026-10-17 |
| Value Add VC | 8.5 | x EV/NTM revenue, stated as a median | Mid-2026 | Public SaaS median as first published; withdrawn on September 30, 2026 as unsupported | 2026-06-21 (corrected 2026-09-30) | 2026-10-17 |
| Value Add VC, citing Clouded Judgement | 3.4 | x EV/NTM revenue, median | June 5, 2026 | Clouded Judgement median for public cloud software, adopted in Value Add VC's correction | 2026-09-30 | 2026-10-17 |
| Clouded Judgement (Jamin Ball) | 4.5 | x EV/NTM revenue, median | Week to October 16, 2026 | Enterprise value divided by NTM revenue; overall median of Clouded Judgement's public cloud software set; median projected growth 13% | 2026-10-16 | 2026-10-17 |
| Software Equity Group | 3.2 | x EV/TTM revenue, median | 2Q26 | SEG SaaS Index of 106 public SaaS companies; enterprise value divided by trailing twelve-month revenue | 2026 (2Q26 report) | 2026-10-17 |
| Software Equity Group | 3.7 | x EV/TTM revenue, median | 2Q26 | Vertically focused companies within the SEG SaaS Index | 2026 (2Q26 report) | 2026-10-17 |
| Software Equity Group | 4.5 | x EV/TTM revenue, median | October 17, 2026 | SEG SaaS Index, daily data on the live index page | Live index page, read 2026-10-17 | 2026-10-17 |
| Software Equity Group | 4.0 | x EV/TTM revenue, median | 2Q26 | Private SaaS M&A transactions | 2026 (2Q26 report) | 2026-10-17 |
| Caspr (Study: Vertical SaaS Valuations 2025–2026) | 8.2 | x average revenue multiple | August 16, 2026 | Average public cloud multiple from Bessemer-linked tracking, recorded in the Study and labeled an average | 2026-08-25 | 2026-10-17 |
| Caspr (Study: Vertical SaaS Valuations 2025–2026) | 3.3 | x EV/NTM revenue | August 25, 2026 | Real estate software and financial services software segments (Multiples.vc), recorded in the Study on a forward basis | 2026-08-25 | 2026-10-17 |
| Multiples.vc | 3.2 | x EV/NTM revenue | October 2026 | Real estate software segment | 2026-10-09 | 2026-10-17 |
| Multiples.vc | 3.0 | x EV/NTM revenue | October 2026 | Financial services software segment | 2026-10-09 | 2026-10-17 |
| Multiples.vc | 2.2 | x EV/NTM revenue, median | October 2026 | Median across vertical SaaS segments | 2026-10-09 | 2026-10-17 |
Where the numbers differ, and why
- definitionalBessemer cloud index average revenue multiple, 8.0x (October 17, 2026) and SEG SaaS Index median EV/TTM, 3.2x (2Q26)An average against a median; members averaging 20.6% revenue growth against 106 public SaaS companies; a headline that does not name its denominator against trailing revenue; dates four months apart.
- genuineValue Add VC's 8.5x NTM median, since withdrawn (mid-2026) and Clouded Judgement's 3.4x NTM median (June 5, 2026)Same statistic, same denominator, same period, and they did not agree. The publisher withdrew 8.5x on September 30, 2026 as unsupported and adopted 3.4x.
- definitionalClouded Judgement median EV/NTM, 4.5x (week to October 16, 2026) and SEG SaaS Index median EV/TTM, 4.5x (October 17, 2026)Identical figures on different denominators and different sets of companies. On one company growing 13%, 4.5x forward equals about 5.1x trailing.
- definitionalSEG vertically focused median EV/TTM, 3.7x (2Q26) and Multiples.vc vertical SaaS median EV/NTM, 2.2x (October 2026)Trailing against forward revenue, different universes of listed companies, and dates a quarter apart.
| Measure | The 8.5x kind of figure: an index average | The 3.3x kind of figure: a broad trailing median |
|---|---|---|
| Current reading | 8.0x average revenue multiple, BVP Nasdaq Emerging Cloud Index, October 17, 2026 | 3.2x median EV/TTM, SEG SaaS Index, 2Q26 (4.5x on the live index, October 17, 2026) |
| Statistic | Average, pulled up by the highest multiples | Median, the middle company |
| Denominator | Not named in the headline label | Trailing twelve-month revenue |
| Peer set | Cloud companies averaging 20.6% revenue growth | 106 public SaaS companies; median trailing growth 13.3% |
| Right for | Placing a fast-growing public cloud company against its index | Benchmarking a typical public SaaS company on reported revenue |
| Wrong for | A median, or a private company's entry multiple | A high-growth asset priced on its forecast |
Frequently asked questions
Is an EV/NTM multiple always lower than EV/TTM?
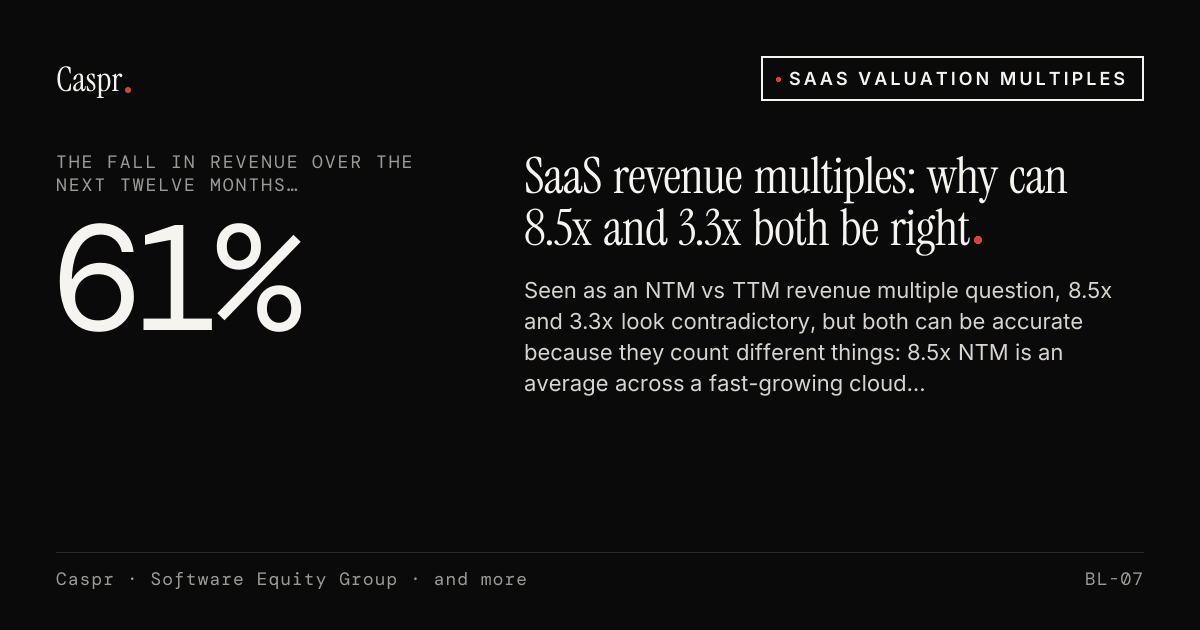
Yes, EV/NTM is lower than EV/TTM for any company expected to grow revenue. The forward denominator is bigger, so the multiple is smaller by the growth factor: at 13% expected growth, 5.1x trailing equals 4.5x forward. If forward sits above trailing, the market expects revenue to shrink: 8.5x NTM against 3.3x TTM implies a 61% fall.
What is the median SaaS revenue multiple in October 2026?
The median SaaS revenue multiple read 4.5x in October 2026, on two different denominators. Clouded Judgement put the median public cloud company at 4.5x EV/NTM revenue in the week to October 16, 2026. Software Equity Group's live index showed a 4.5x median on EV/TTM revenue on October 17. The two match by coincidence: they cover different companies.
Which revenue multiple should I use to value a private SaaS company?
Value a private SaaS company on trailing revenue or current ARR, as private buyers do, and treat forward revenue as a case to defend. Software Equity Group put the median private SaaS acquisition at 4.0x EV/TTM revenue in 2Q26. Adjust for growth, retention and scale against named public comparables on the same basis, never an index average.
Can I combine NTM and TTM multiples from different sources?
Not until NTM and TTM multiples share a denominator. Blending 8.5x and 3.3x gives a number that describes no company and no index. Restate each comparable on the target's basis with its own expected growth, using EV/TTM equals EV/NTM times one plus growth. Then set medians against medians from peer sets with similar growth.
What is the difference between LTM and TTM?
There's no difference in substance between LTM and TTM. Last twelve months and trailing twelve months both cover revenue reported over the most recent four quarters. What matters is LTM or TTM against NTM, the next twelve months, which is a forecast: consensus estimates for a listed company, the management case in a private process.
Try it on Caspr
Value a private US vertical SaaS company with $25M ARR growing 30%: bridge public EV/NTM comparables to an EV/TTM entry multiple and set it against 2026 private SaaS M&A medians, sourced for an investment committee
Run the analysis